Pensacola Discussion Forum
Would you like to react to this message? Create an account in a few clicks or log in to continue.

This is a forum based out of Pensacola Florida.


You are not connected. Please login or register

From 1910 to 1960, the ratio of hot records to cold records was roughly 1:1. From 1960 to 2014, the ratio of hot records to cold records was 12:1.

4 posters

Go down  Message [Page 1 of 1]

boards of FL

boards of FL

http://www.washingtonpost.com/news/energy-environment/wp/2015/09/09/the-simple-statistic-that-perfectly-captures-what-climate-change-means/


There are many ways to measure the world’s changing climate. You can chart rising global temperatures, rising sea levels and melting ice. What’s tougher, though, is to find a measurement that easily relates all of that to what people experience in their daily lives.

In a new study in Geophysical Research Letters, however, two Australian researchers do just this by examining a simple but telling meteorological metric — the ratio of new hot temperature records set in the country to new cold temperature records.

“In a stationary climate, a climate where we don’t have any trend or long-term change, we expect hot and cold records to be broken at almost the same rate,” explains Sophie Lewis, the lead study author and a researcher at the Australian National University in Canberra. “But in the last 15 years, we see a dramatic increase in the frequency of hot records and the decrease of cold records.”

Australia has warmed nearly 1 degree Celsius since 1910, and has experienced plenty of extreme heat recently, especially during the famous “angry summer” of 2012-2013. In particular, the year 2013 broke all manner of country-wide temperature records: “hottest day, week, month, and season observed, and it was the warmest year on record,” note Lewis and her co-author, Andrew King of the University of Melbourne.

So how unusual was this? And would it be likely to happen in a climate unperturbed by human greenhouse gas emissions?

Lewis and King looked at how often Australia set hot and cold temperature records from the year 1910 through 2014. They only considered temperature records across the country as a whole and in each of its states or territories (except Tasmania), and only examined monthly, seasonal and annual records. Thus, the study did not examine daily records or records in individual locations. (This was in part to avoid problems introduced by the fact that over time, the number of individual temperature recording stations changes.)

Sure enough, the study found that from 1910 to 1960, the ratio of hot to cold records was close to 1 to 1. From 1960 to 2014, however, that changed, as hot records started to happen much more frequently than cold records — and from 2000 to 2014, outnumbered them by more than 12 to 1.

“Over this last period, the probability of cold record-breaking is generally low and the number of new cold temperature records set approaches zero,” the study observes. It’s hard to imagine why you would get such a striking result if not for a changing climate.

Indeed, as one 2012 study put it, “If the average temperature rises, then obviously so will the number of heat records, all else remaining equal.”

The new finding is similar to — but more dramatic than — a 2009 study that found that hot records outpaced cold records by a ratio of roughly 2 to 1 in the United States in the 2000s. That study also forecast that the gap between hot and cold records should widen as climate change continues.

A prior study of Australian temperature records found that from 1997 through 2009, the ratio of hot temperature to low temperature records was less dramatically skewed, though it was still “above 2 to 1.” The new study, which runs through 2014, suggests that the gap is widening.

Indeed, Lewis underscores that while the ratio was particularly dramatic after 2000, “This isn’t a result of only a few years; this is a trend since 1960.”

The new study also used climate modeling experiments to examine whether the skewed pattern of broken temperature records was recapitulated when the simulation did, and did not, include human-induced greenhouse gases. Only in the first case did the model produce a trend toward more hot record-breaking than cold record-breaking.

“In the anthropogenically forced case, the average number of hot records increases through time, while the number of cold records concomitantly decreases,” the modeling result found.

“The recent rate of hot record-breaking dramatically exceeds that expected in a stationary climate,” the paper concludes.

“There’s a lot of rhetoric in Australia that new hot records don’t mean anything, [that] it just means we’ve been keeping records for longer,” says Lewis. “So it was important for us to clear up that this large increase in the number of hot records is related to the greenhouse gases.”


_________________
I approve this message.

TEOTWAWKI

TEOTWAWKI

Well it seems obvious that we had a normal climate until we stopped pollution....

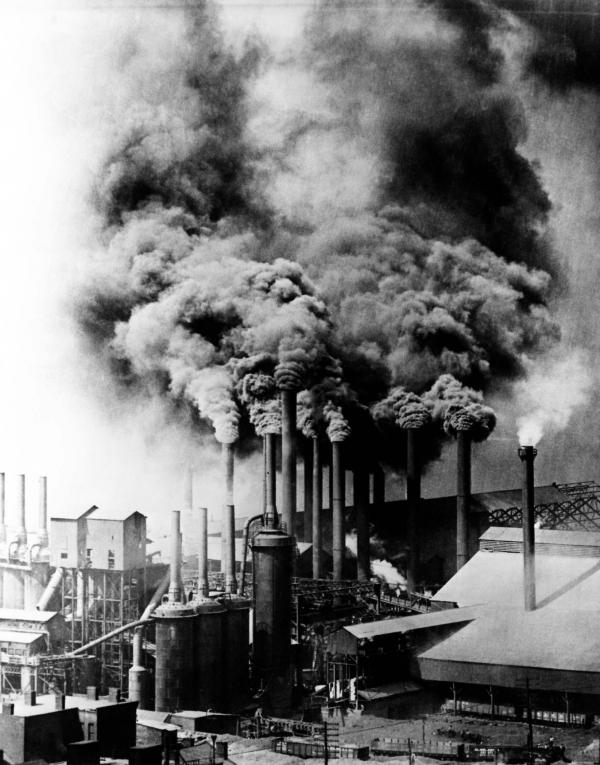
Smoke pouring into the air from a Pittsburgh steel mill, 1906.


From 1910 to 1960, the ratio of hot records to cold records was roughly 1:1.  From 1960 to 2014, the ratio of hot records to cold records was 12:1. 1-2-444-25-ExplorePAHistory-a0b6r5-a_349

"Hell with the lid off," was an apt description of Pittsburgh during its peak decades of industrial production. In the late nineteenth and early twentieth centuries, Pittsburgh ran on bituminous coal. Each month the steam boilers and furnaces of its industries, railroads, and homes dumped 100 tons of pollutants on its streets.

Guest


Guest

Garbage in... garbage out.

http://www.commdiginews.com/featured...xamined-46929/

Finally, in late 2013, the International Panel on Climate Change (IPCC) acknowledged the existence of the pause, renaming it a “hiatus” from global warming. Since then, at least 50 papers have appeared in the scientific literature explaining where the missing heat went.

The existence of a 17-year, unanticipated “hiatus” in the face of rapidly increasing CO emissions is jeopardizing the AGW theory. Fifty different concocted explanations for the unexpected, unpredicted disappearance of warming doesn’t help.

In steps Karl to the rescue. He and his co-authors reanalyzed the Extended Reconstructed Sea Surface Temperature (ERSSTv4) dataset. Seventy percent of earth’s surface and 90 percent of its surface heat is tied to oceans.

The graph above compares the reanalyzed dataset with the previous version (ERSSTv3b). The reanalyzed version creates global warming after 2004 where little had previously existed. In one fell swoop, the “hiatus” just disappears.

The main reason for that is that Karl added 0.12°C to all Argo buoy temperature readings and gave them added weighting when calculating the reanalyzed dataset, according to a critique of Karl’s paper by Dr. Ross McKitrick.

The Argo array and ship-based temperature measurements are in disagreement. Argo’s temperatures are colder than ship-based temperatures and show no sea surface temperature increases since its earliest measurements began. Karl’s change to Argo data increases global temperatures after 2004, when Argo buoys started showing up in large numbers. The Argo network went fully operational in late 2007 with 3,000 floats in place.

The international Argo array is a wonder of modern climate science technology. It consists of nearly 3,900 specially designed buoys distributed in oceans all over the world. Each self-contained robotic buoy records ocean temperature, salinity and ocean drift to a depth of 6,500 feet. They normally free float at 3,000 feet. Every 10 days they dive to depth and then return to the surface, taking measurements all along the way. Once surfaced, they automatically upload their collected data via satellite into a global database.

Argo is specifically designed for climate science. Ship-based measurements are not. Ships have taken measurements in many different ways over the years. Most modern-day water temperature readings from ships are taken from boiler room water intakes not designed for rigorous scientific purposes. Those have a built-in heat bias.

INSTEAD OF LOGICALLY RECALIBRATING THE LESS RELIABLE SHIP-BASED DATA TO MATCH THE ARGO DATA, KARL ALTERS THE ARGO DATA TO MATCH THE SHIP-BASED INSTRUMENTS.

It’s hard to see visually in the above ERSST comparison, but trend analysis shows older temperature data BEFORE1976 —was adjusted slightly DOWNWARD, while data were adjusted UPWARD AFTER 2004 in the reanalysis. Measurements after 1976 are also adjusted upward. THAT CONVENIENTLY INCREASES THE SLOPE OF GLOBAL WARMING IN FAVOR OF AGW THEORY.

The Karl paper came out in June. In less than two months, its results and methods have been incorporated into virtually all major ground-based global temperature databases.

THE ARGO ARRAY ITSELF SHOWS NO WARMING SINCE 1997. Satellite-based global sea surface data, unaffected by Karl’s results, show NO WARMING IN THE LOWER TROPOSPHERE SINCE 1997. They all support the existence of the hiatus.

Clearly, either Argo and the satellites are wrong, or Karl’s reanalysis is wrong. The hiatus is either real or it is not.

This much is certain, though: The science is not settled.

2seaoat


"Hell with the lid off," was an apt description of Pittsburgh during its peak decades of industrial production. In the late nineteenth and early twentieth centuries, Pittsburgh ran on bituminous coal. Each month the steam boilers and furnaces of its industries, railroads, and homes dumped 100 tons of pollutants on its streets.


As a kid I could smell Birmingham thirty miles out. It is amazing how we have cleaned up in the last fifty years, but the total man made pollution pouring into our atmosphere has grown worldwide.....so Birmingham when you are passing through on 65 as clear skies and you can see Vulcan all across the valley, but we are still pouring crap into the air.

Markle

Markle

Yes, we had so much more sophisticated instruments, around the World from 1910 to 1960. A fraction of an instant.

From 1910 to 1960, the ratio of hot records to cold records was roughly 1:1.  From 1960 to 2014, the ratio of hot records to cold records was 12:1. LOL_zpsrc5py0ql

Sponsored content


Back to top  Message [Page 1 of 1]

Permissions in this forum:
You cannot reply to topics in this forum